The previous post: Find your best fit
This post is a continuation of the previous one. This one shall discuss a few more ways of evaluating a Machine Learning Algorithm – a Classification Model, in particular.
Learning Curve
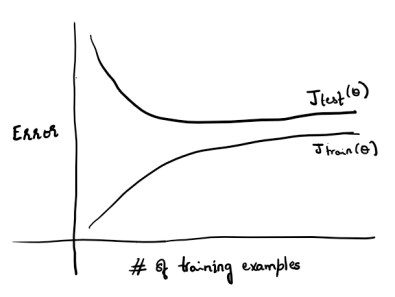
Say we have fit some function to ‘x’ number of training samples. The error of this function keeps increasing, as more and more data samples are added. However, after a certain limit, say ‘n’ number of samples, the error value will plateau.
Plotting a learning curve can assist in taking decisions on collecting more samples to enhance the performance of the classifier on the Test set. It is not going to make much difference to the performance if the learning curve has already reached the plateau.
Precision and Recall
Let’s consider an Email Spam Classifier. The prediction of the classifier vs the actual result, can be one of the following: [Here, 0 -> False, 1 -> True]
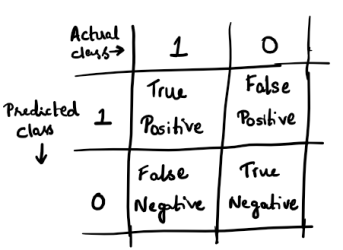
If the spam classifier predicts an email to be a spam (Predicted class is 1) and it turns out to be actually a spam (i.e. Actual class is also 1) then the result is said to be ‘True Positive’. The classification was accurate. However, if the spam classifier classifies the email to be a spam (Predicted class is 1) and the email is not actually a spam (Actual class is 0) then the result is said to be ‘False Positive’. The classifier seems to have erroneously classified the mail as spam. False Negative and True Negative can be similarly interpreted.
Precision and Recall are further used to calculate F1-Score, that measures the performance of a classification algorithm. Let us see what they mean and how they are calculated.
Precision = True Positive/(True Positive + False Positive)
Precision: Of all the emails that were predicted to be spam, the fraction of those that were actually spam is called the Precision.
Recall = True Positive / (True Positive + False Negative)
Recall: Of all the emails that actually are spam, Recall is the fraction that was correctly predicted as spam.
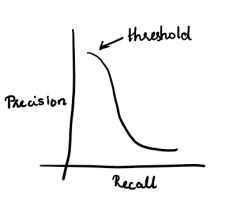
The relationship between Precision and Recall is illustrated in this graph. They are inversely related. There is a threshold where the classifier performs the best and has the highest precision.
F1-Score
F1-Score is the weighted average of Precision and Recall. It is calculated as:
F1-Score = 2 (Precision * Recall) / (Precision + Recall)
Here’s an example of three different algorithms with their precision, recall and F1 score:
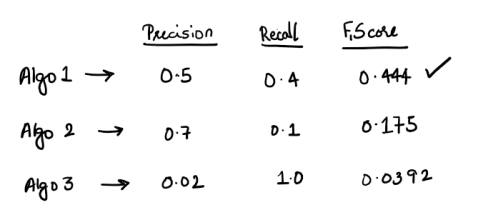
The first algorithm has the highest F-Score and hence performs the best.
Evaluating an Algorithm at an early stage results in making a calculative decision on further steps to be taken to improve performance. It is usually suggested to make a very quick and dirty implementation using a simple algorithm initially, and then improvise, by analyzing the algorithm and taking decisions like adding more/reducing features, collecting more samples etc.

Leave a comment